Exploration

library(plyr)  # for data processing/cleaning
library(dplyr) #for data processing/cleaning
Warning: package 'dplyr' was built under R version 4.2.2

Attaching package: 'dplyr'
The following objects are masked from 'package:plyr':

    arrange, count, desc, failwith, id, mutate, rename, summarise,
    summarize
The following objects are masked from 'package:stats':

    filter, lag
The following objects are masked from 'package:base':

    intersect, setdiff, setequal, union
library(tidyselect)# for datawrangling
Warning: package 'tidyselect' was built under R version 4.2.2
library(tidymodels)#for modeling
Warning: package 'tidymodels' was built under R version 4.2.2
── Attaching packages ────────────────────────────────────── tidymodels 1.0.0 ──
✔ broom        1.0.1     ✔ rsample      1.1.1
✔ dials        1.1.0     ✔ tibble       3.1.8
✔ ggplot2      3.4.0     ✔ tidyr        1.2.0
✔ infer        1.0.4     ✔ tune         1.0.1
✔ modeldata    1.1.0     ✔ workflows    1.1.3
✔ parsnip      1.0.4     ✔ workflowsets 1.0.0
✔ purrr        0.3.4     ✔ yardstick    1.1.0
✔ recipes      1.0.5     
Warning: package 'dials' was built under R version 4.2.2
Warning: package 'ggplot2' was built under R version 4.2.2
Warning: package 'infer' was built under R version 4.2.2
Warning: package 'modeldata' was built under R version 4.2.2
Warning: package 'parsnip' was built under R version 4.2.2
Warning: package 'recipes' was built under R version 4.2.2
Warning: package 'rsample' was built under R version 4.2.2
Warning: package 'tune' was built under R version 4.2.2
Warning: package 'workflows' was built under R version 4.2.2
Warning: package 'workflowsets' was built under R version 4.2.2
Warning: package 'yardstick' was built under R version 4.2.2
── Conflicts ───────────────────────────────────────── tidymodels_conflicts() ──
✖ dplyr::arrange()   masks plyr::arrange()
✖ purrr::compact()   masks plyr::compact()
✖ dplyr::count()     masks plyr::count()
✖ dplyr::desc()      masks plyr::desc()
✖ purrr::discard()   masks scales::discard()
✖ dplyr::failwith()  masks plyr::failwith()
✖ dplyr::filter()    masks stats::filter()
✖ dplyr::id()        masks plyr::id()
✖ dplyr::lag()       masks stats::lag()
✖ dplyr::mutate()    masks plyr::mutate()
✖ dplyr::rename()    masks plyr::rename()
✖ recipes::step()    masks stats::step()
✖ dplyr::summarise() masks plyr::summarise()
✖ dplyr::summarize() masks plyr::summarize()
• Use suppressPackageStartupMessages() to eliminate package startup messages
library(tidyr) #for data processing/cleaning
library(skimr) #for nice visualization of data 
Warning: package 'skimr' was built under R version 4.2.2
library(here)  #to set paths 
here() starts at C:/Data/GitHub/MADA23/betelihemgetachew-MADA-portfolio2

Attaching package: 'here'
The following object is masked from 'package:plyr':

    here
library(gmodels)#to look at the tables 
Warning: package 'gmodels' was built under R version 4.2.2
library(ggplot2) #to plot histograms and charts
library(olsrr)# for variable selection
Warning: package 'olsrr' was built under R version 4.2.2

Attaching package: 'olsrr'
The following object is masked from 'package:datasets':

    rivers
library(tibble)#for better organization of hte data
library(gt)
Warning: package 'gt' was built under R version 4.2.2

Load cleaned data set

Create path to cleaned data set

data_location <- here::here("fluanalysis","processed_data","Processed_data.RDS")

Load cleaned data set into r

Clean_df<- readRDS(data_location)
Clean<-as_tibble(Clean_df)

#Sometimes you can get a sense of the dataset if the variables names are descriptive

names(Clean)
 [1] "SwollenLymphNodes" "ChestCongestion"   "ChillsSweats"     
 [4] "NasalCongestion"   "CoughYN"           "Sneeze"           
 [7] "Fatigue"           "SubjectiveFever"   "Headache"         
[10] "Weakness"          "WeaknessYN"        "CoughIntensity"   
[13] "CoughYN2"          "Myalgia"           "MyalgiaYN"        
[16] "RunnyNose"         "AbPain"            "ChestPain"        
[19] "Diarrhea"          "EyePn"             "Insomnia"         
[22] "ItchyEye"          "Nausea"            "EarPn"            
[25] "Hearing"           "Pharyngitis"       "Breathless"       
[28] "ToothPn"           "Vision"            "Vomit"            
[31] "Wheeze"            "BodyTemp"         

#Get familiar with variables

class(Clean)
[1] "tbl_df"     "tbl"        "data.frame"
summary(Clean)
 SwollenLymphNodes ChestCongestion ChillsSweats NasalCongestion CoughYN  
 No :418           No :323         No :130      No :167         No : 75  
 Yes:312           Yes:407         Yes:600      Yes:563         Yes:655  


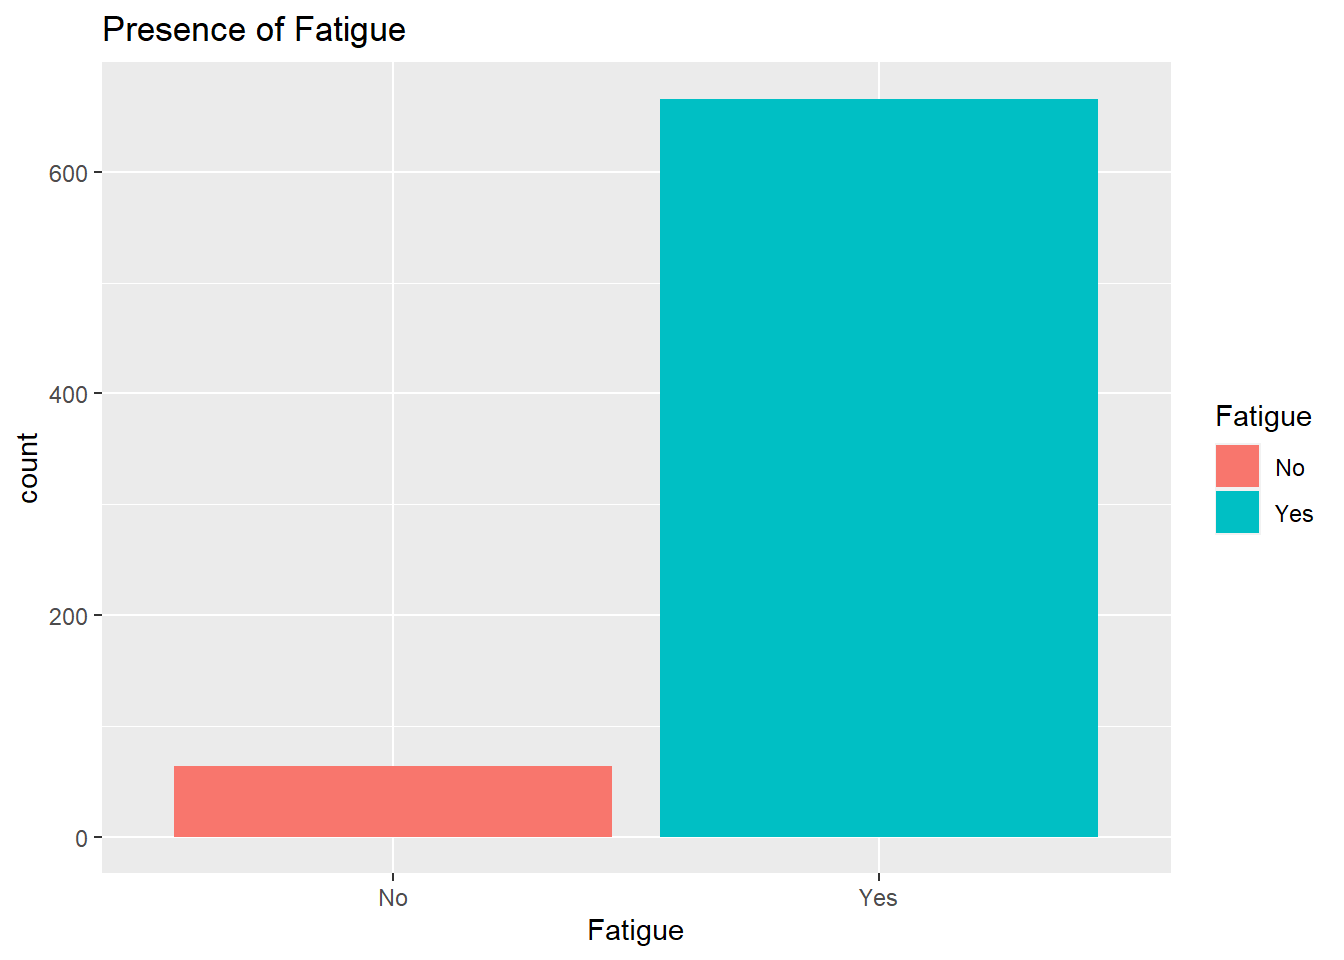
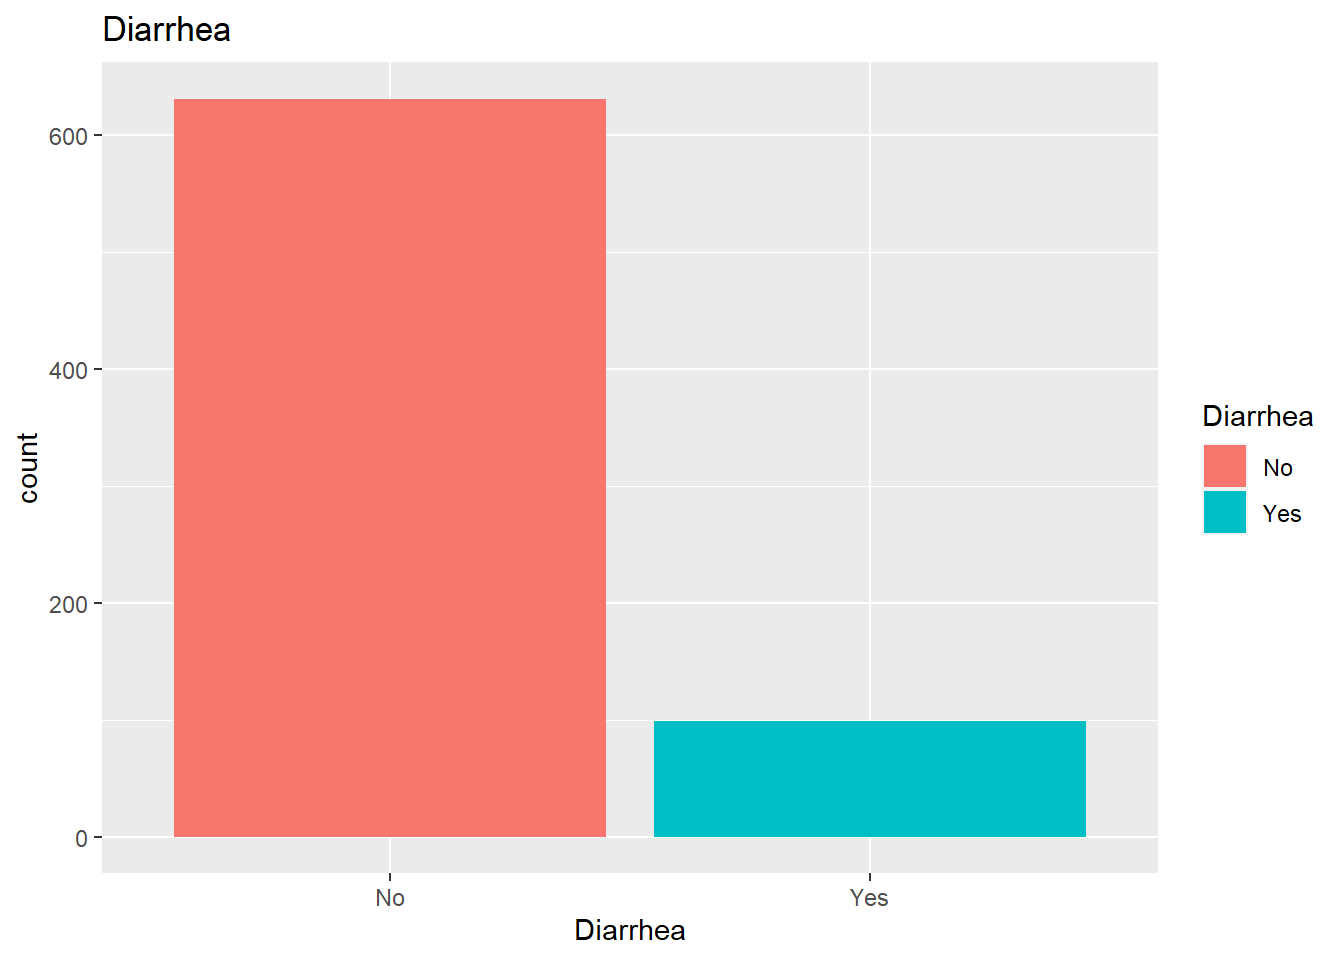
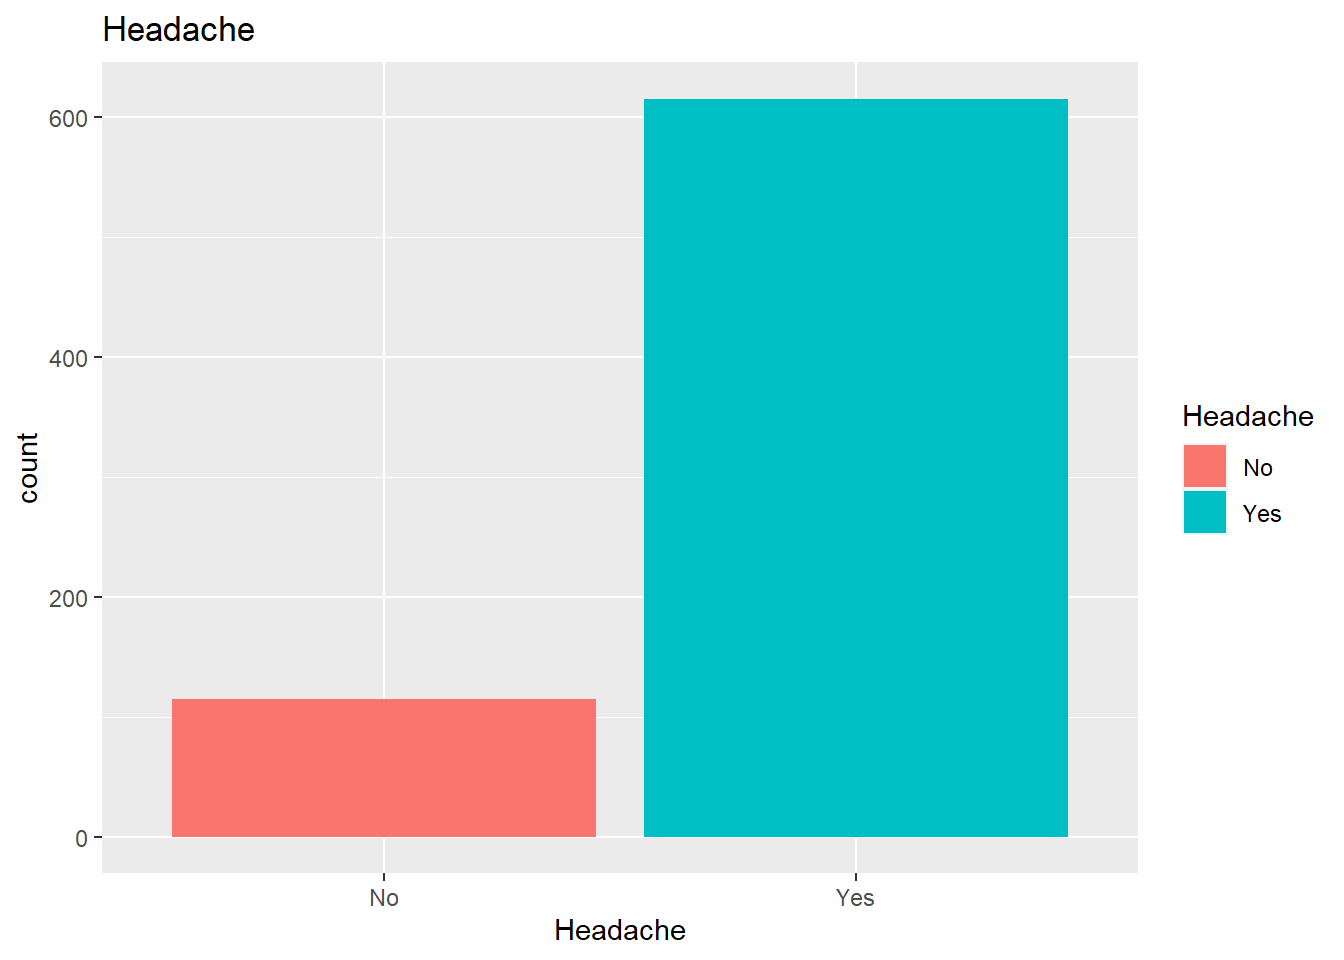
 Sneeze    Fatigue   SubjectiveFever Headache      Weakness   WeaknessYN
 No :339   No : 64   No :230         No :115   None    : 49   No : 49   
 Yes:391   Yes:666   Yes:500         Yes:615   Mild    :223   Yes:681   
                                               Moderate:338             
                                               Severe  :120             
                                                                        
                                                                        
  CoughIntensity CoughYN2      Myalgia    MyalgiaYN RunnyNose AbPain   
 None    : 47    No : 47   None    : 79   No : 79   No :211   No :639  
 Mild    :154    Yes:683   Mild    :213   Yes:651   Yes:519   Yes: 91  
 Moderate:357              Moderate:325                                
 Severe  :172              Severe  :113                                
                                                                       
                                                                       
 ChestPain Diarrhea  EyePn     Insomnia  ItchyEye  Nausea    EarPn    
 No :497   No :631   No :617   No :315   No :551   No :475   No :568  
 Yes:233   Yes: 99   Yes:113   Yes:415   Yes:179   Yes:255   Yes:162  


 Hearing   Pharyngitis Breathless ToothPn   Vision    Vomit     Wheeze   
 No :700   No :119     No :436    No :565   No :711   No :652   No :510  
 Yes: 30   Yes:611     Yes:294    Yes:165   Yes: 19   Yes: 78   Yes:220  


    BodyTemp     
 Min.   : 97.20  
 1st Qu.: 98.20  
 Median : 98.50  
 Mean   : 98.94  
 3rd Qu.: 99.30  
 Max.   :103.10  

Summary tables for select categorical variables

Clean %>% 
group_by(Nausea,Vomit)%>%
tally()%>%
  gt()%>%
  tab_header(title=("Summary Table: Nausea and Vomit"))
Summary Table: Nausea and Vomit
Vomit n
No
No 461
Yes 14
Yes
No 191
Yes 64
Clean %>% 
group_by(Nausea,Diarrhea)%>%
tally()%>%
gt()%>%
  tab_header(title=("Summary Table: Nausea and Diarrhea "))
Summary Table: Nausea and Diarrhea
Diarrhea n
No
No 435
Yes 40
Yes
No 196
Yes 59
Clean %>% 
group_by(Nausea,Weakness)%>%
tally()%>%
gt()%>%
  tab_header(title=("Summary Table: Nausea and Weakness "))
Summary Table: Nausea and Weakness
Weakness n
No
None 39
Mild 172
Moderate 210
Severe 54
Yes
None 10
Mild 51
Moderate 128
Severe 66

Note: Very few people seem to have experienced Nausea with vomit and Nausea with Diarrhea; and Nausea with Weakness as symptom in this sample.

Mean temperature by group

Clean %>% 
  group_by(CoughYN)%>%
  summarise_at(vars(BodyTemp), list(Temp=mean))%>%
gt()%>%
  tab_header(title=("Mean Body Temp by Cough"))
Mean Body Temp by Cough
CoughYN Temp
No 98.70800
Yes 98.96107
Clean %>% 
  group_by(Fatigue)%>%
  summarise_at(vars(BodyTemp), list(Temp=mean))%>%
gt()%>%
  tab_header(title=("Mean Body Temp by Fatigue"))
Mean Body Temp by Fatigue
Fatigue Temp
No 98.58594
Yes 98.96862
Clean %>% 
  group_by(SubjectiveFever)%>%
  summarise_at(vars(BodyTemp), list(Temp=mean)) %>%
gt()%>%
  tab_header(title=("Mean Body Temp and Subjective Fever"))
Mean Body Temp and Subjective Fever
SubjectiveFever Temp
No 98.57391
Yes 99.10120
Clean %>% 
  group_by(Headache)%>%
  summarise_at(vars(BodyTemp), list(Temp=mean))%>%
gt()%>%
  tab_header(title=("Mean Body Temp by Headache"))
Mean Body Temp by Headache
Headache Temp
No 98.85304
Yes 98.95041
Clean %>% 
  group_by(Weakness)%>%
  summarise_at(vars(BodyTemp), list(Temp=mean))%>%
gt()%>%
  tab_header(title=("Mean Body Temp by Weakness"))
Mean Body Temp by Weakness
Weakness Temp
None 98.60816
Mild 98.86457
Moderate 98.92515
Severe 99.22750
Clean %>% 
  group_by(Vomit)%>%
  summarise_at(vars(BodyTemp), list(Temp=mean))%>%
gt()%>%
  
  tab_header(title=("Mean Body Temp by presence or abscence of vomit"))
Mean Body Temp by presence or abscence of vomit
Vomit Temp
No 98.90613
Yes 99.17692
Clean %>% 
  group_by(Diarrhea)%>%
  summarise_at(vars(BodyTemp), list(name=mean))%>%
gt()%>%
  tab_header(title=("Mean Body Temp by presence of Diarrhea"))
Mean Body Temp by presence of Diarrhea
Diarrhea name
No 98.94960
Yes 98.84242

Notes: The mean temperature of people who have cough, have fatigue, had slightly higher temperature. Those who had subjective fever also had higher body temperature. There were that much difference in body temperature of those with or without headache, as well as those with or without diarrhea. As the weakness level increases, so does the mean body temperature.

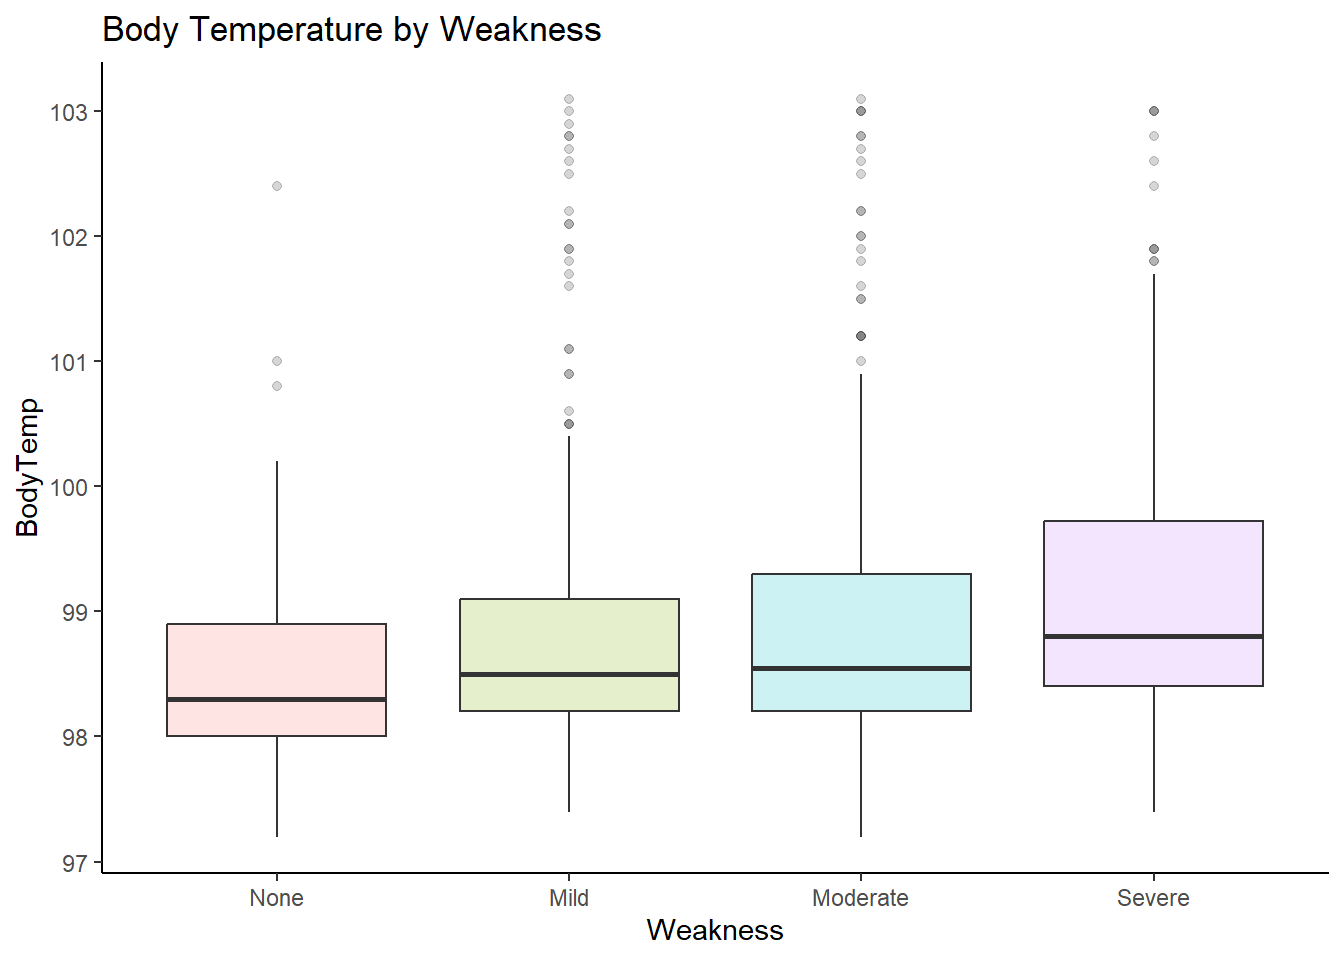
Box plot to see the mean body temperature across various weakness levels.

ggplot(Clean, aes(Weakness, BodyTemp))+
  labs(x="Weakness", y = "BodyTemp")+ ggtitle("Body Temperature by Weakness")+
  geom_boxplot(aes(fill=Weakness), size= 0.5, alpha = 0.2)+
  theme_classic()+
  theme(legend.position = "none")

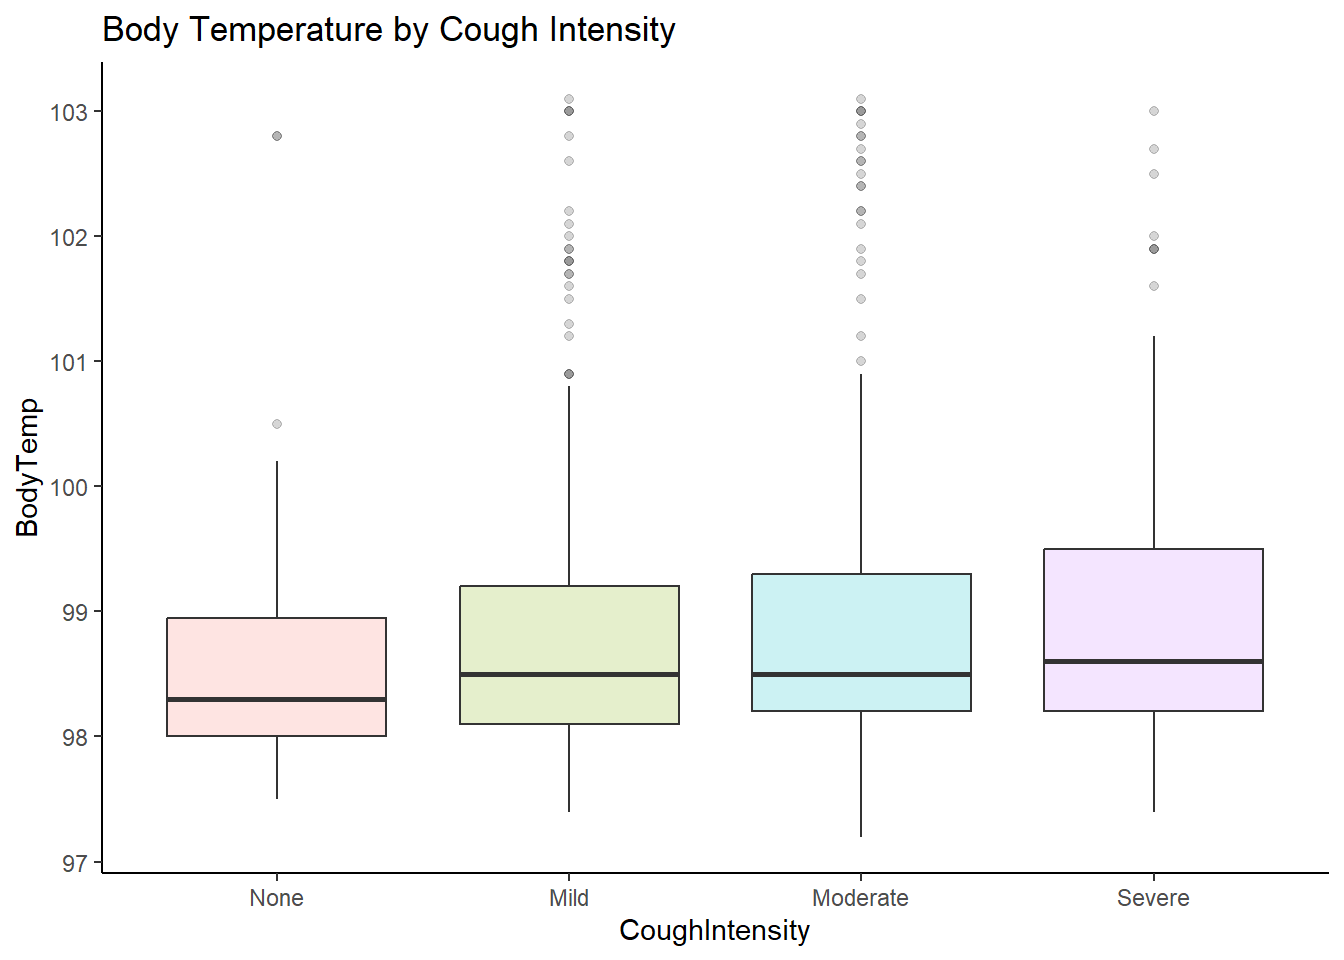
Box plot to see the mean body temperature by cough intensity level.

ggplot(Clean, aes(CoughIntensity, BodyTemp))+
  labs(x="CoughIntensity", y = "BodyTemp")+ ggtitle("Body Temperature by Cough Intensity")+
  geom_boxplot(aes(fill=CoughIntensity), size= 0.5, alpha = 0.2)+
  theme_classic()+
  theme(legend.position = "none")

Note: A visualization of the mean body temperature increasing as weakness level increases from none to mild weakness, to moderate weakness, to severe weakness. Similarly, as cough intensity increases so does the body temperature.

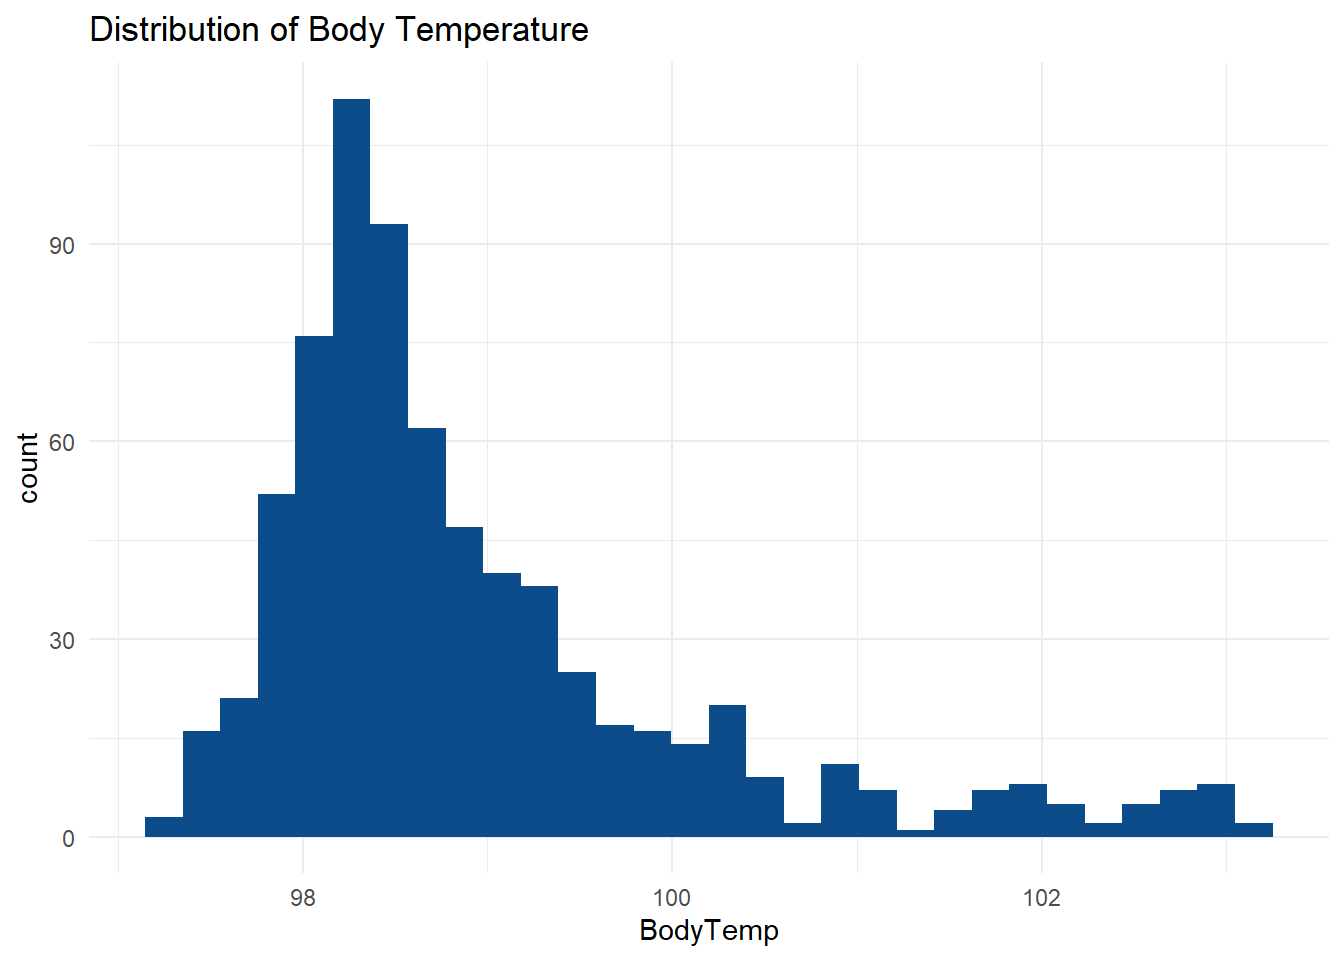
Distribution of body temperature

 ggplot(Clean)+
  aes(x=BodyTemp)+ geom_histogram(bins=30L,fill="#0c4c8a")+ggtitle("Distribution of Body Temperature")+
  theme_minimal()

#The distribution of body temperature seems slightly skewed to the right which means most peoples body temperature falls to the left of the histogram

Warning: The dot-dot notation (`..count..`) was deprecated in ggplot2 3.4.0.
ℹ Please use `after_stat(count)` instead.

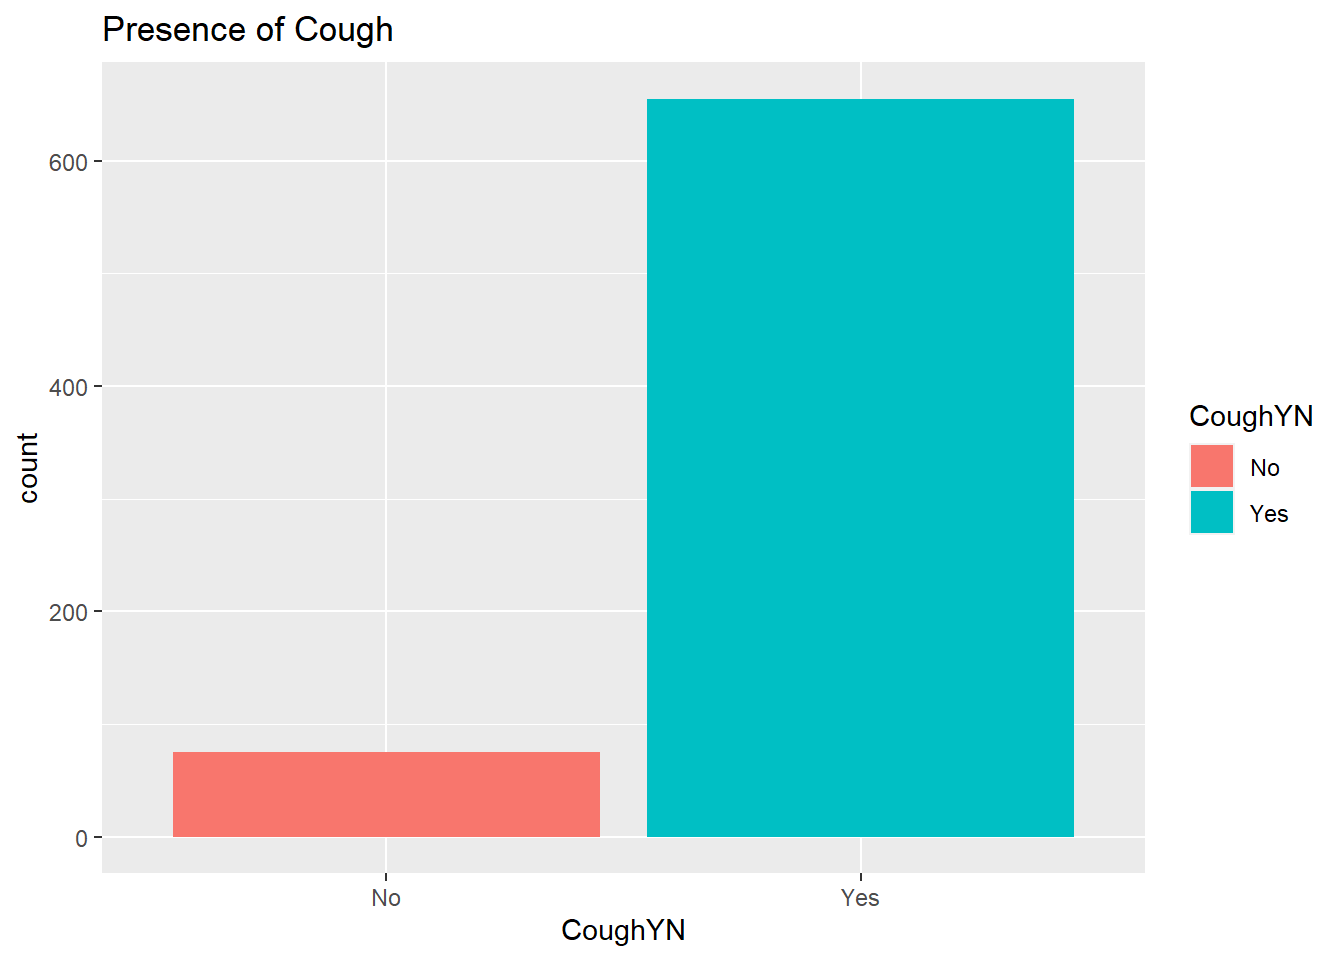
Note: Almost all people experienced cough and fatigue and headache.

Note: Almost all did not experience vomiting, Diarrhea